|
Fishing Planner – Going the Distance
By: Mike Stockwell, Meteorologist
|
|
|
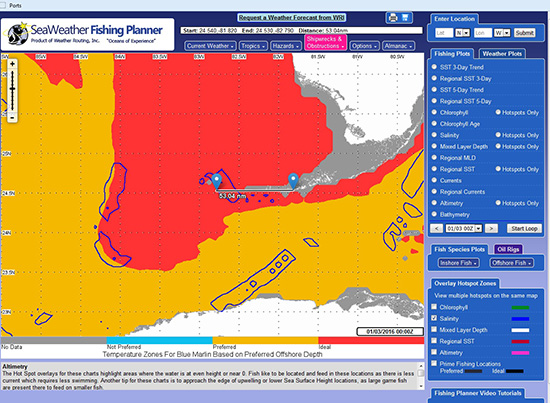
We are happy to introduce a new tool for SeaWeather's Fishing Planner that will give our clients the ability to measure distance from one latitude/longitude marker to another. This Distance Marker tool is available for our Angler’s Basic and Angler's Premium subscribers. This tool will be helpful for any situation, whether it being a short day trip from port or an overnight passage to a more offshore location. Anglers will be able to now determine how far away a prime fishing location will be, or whether a desired location is reachable by daylight.
To access this tool from the Fishing Planner, users select the "Options" drop-down tab from the top menu bar and select "Enable Markers for Distance Calculations." You then simply click on the map to place the first marker, and then click again to place a second marker. The distance between these two markers will then be displayed. A third marker may be placed to determine its distance from the second marker, and so on. The Distance Marker can be over-layed on any of SeaWeather’s weather or fishing plots. This can be useful for many situations, including to determining a distance to a hotspot for a certain species of fish, for example. Another update just implemented now allows anglers to pin locations with markers for fishing hotspots. Users can click and drag these markers to various locations on the chart. The user will then be able to save screenshot images to their computer or device and view these at a later time. This can be useful for evaluating weekly trends, such as sea surface temperature changes, so that one may further hone in the best location to aim for. As always, we welcome any questions or feedback on this feature in a continuous effort to enhance the Fishing Planner product for our clients.--> |
|
All About Waves
By: Jeremy Davis, Operations Manager / Meteorologist
|

|
|
As every mariner knows, the effect of waves on a vessel can range widely. In protected waters, light winds can produce barely a ripple, while strong winds over open waters can produce large, short period dangerous seas. Knowing how waves form and their potential effects on your vessel can help to ensure a smooth transit. There are also quite a few terms involved with dealing with waves, and understanding them is helpful when interpreting our forecasts and recommendations.
How do waves form?
Putting it all together
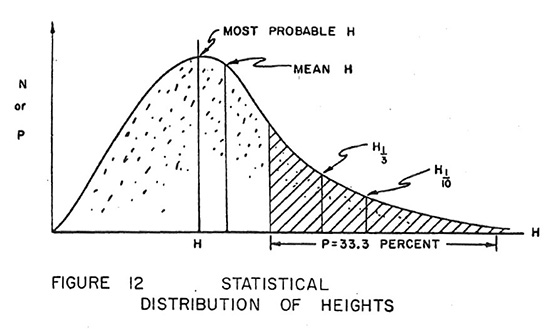
You can be rest assured that at Weather Routing we are constantly monitoring ship and buoy reports, combined with forecast models and our experiences to ensure that all steps are taken to avoid large waves. Knowing your vessel’s weather constraints helps us provide you with the best routing recommendation to keep you out of dangerous areas, or to minimize waves if they are unavoidable. In addition, note that although forecasts may call for a forecast range, there may be rare sets that exceed this by 1 ½ to 2 times as part of the natural distribution of waves. You should always be prepared for the potential for higher wave action, even in times when relatively low seas predominate. |
In this issue:
WRI Services:
Contact us for a Forecast!
wri@wriwx.com
+1-518-798-1110
Visit the new SeaWeather and request a trial!
Racing Forecasts for Racers
WRI Fishing Charts for Anglers!
Marina Forecasts
Heavy Weather Alerts
WRI Meteograms
 Need a Forecast?
Contact our professional meteorologists
24 hours a day, 365 days a year at
(518) 798-1110
or wri@wriwx.com


Unsubscribe
WRI Services:
Contact us for a Forecast!
wri@wriwx.com
+1-518-798-1110
Visit the new SeaWeather and request a trial!
Racing Forecasts for Racers
WRI Fishing Charts for Anglers!
Marina Forecasts
Heavy Weather Alerts
WRI Meteograms
 Need a Forecast?
Contact our professional meteorologists
Need a Forecast?
Contact our professional meteorologists24 hours a day, 365 days a year at
(518) 798-1110
or wri@wriwx.com


Unsubscribe

